Key financial indicators
Macroeconomic factors
In December 2024, the annual inflation rate in Kazakhstan was 8.6%, down from 9.8% in 2023.
Food prices in December increased by 5.5% year-on-year, indicating some acceleration in growth compared to previous months. This trend is driven by a number of factors, including seasonal price fluctuations, changes in global food prices, as well as the impact of domestic factors such as transportation and logistics costs. Non-food products showed an increase of 8.3% over the year, which is also within forecasted values. However, the most pronounced growth was observed in the paid services sector, where the annual price increase was 13.3%.
The foreign exchange market also underwent significant changes. In December 2024, the exchange rate of the KZT against the USD reached KZT 523.54 per dollar, reflecting a 15% depreciation of the national currency since the beginning of the year, which is due to a combination of factors, including increased demand for foreign currency from importers, increased dollarization of the economy, as well as external economic factors such as commodity price dynamics and the policies of the world’s largest central banks.
The reduction of the current account deficit to USD 4.4 billion and the growth of international reserves to USD 105.7 billion indicate an improvement in the country's external economic position. However, ongoing budget expenditures and continued deficit financing from the National Fund represent a long-term challenge to macroeconomic stability. In the future, a possible reduction in budget dependence on transfers and diversification of the country’s economic structure may play a key role in ensuring sustainable economic growth24.
24 Bureau of National Statistics of the Agency for Strategic Planning and Reforms of RK, National Bank of RK, Halyk Finance.
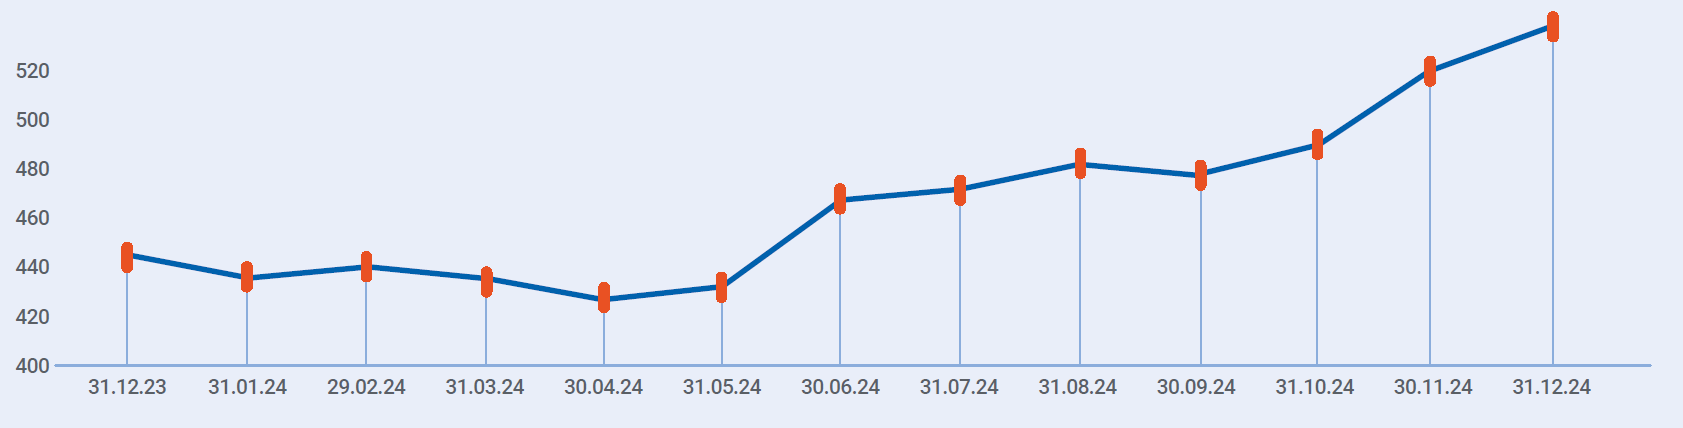
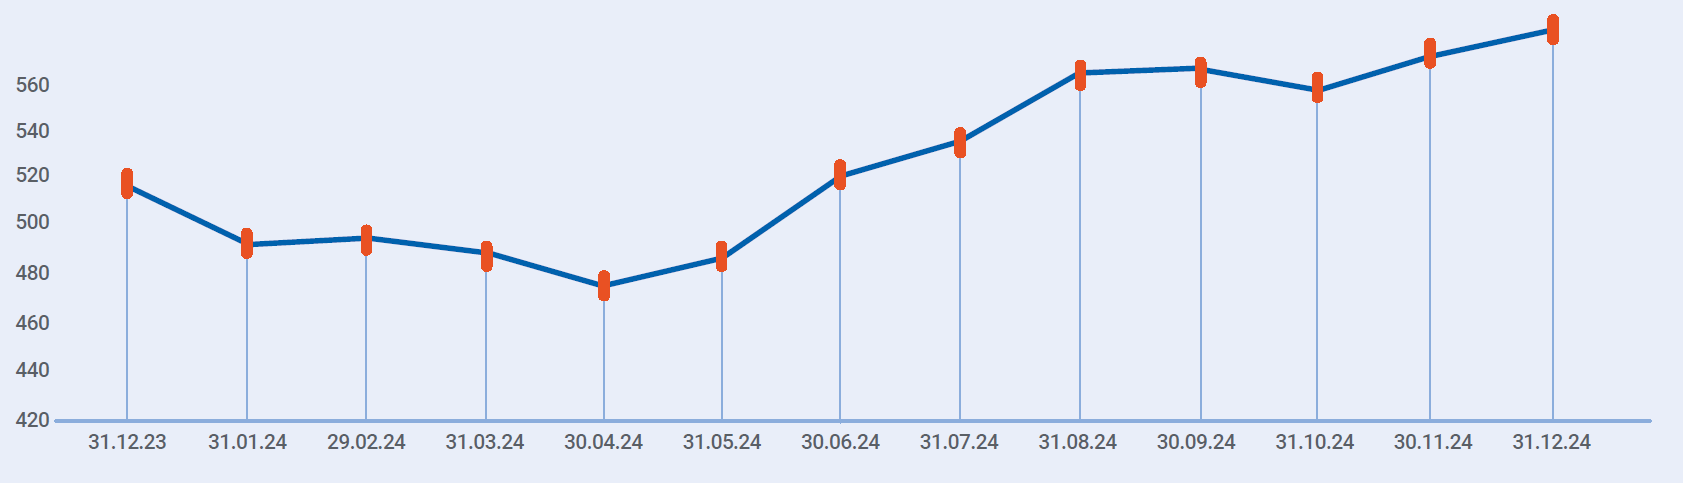
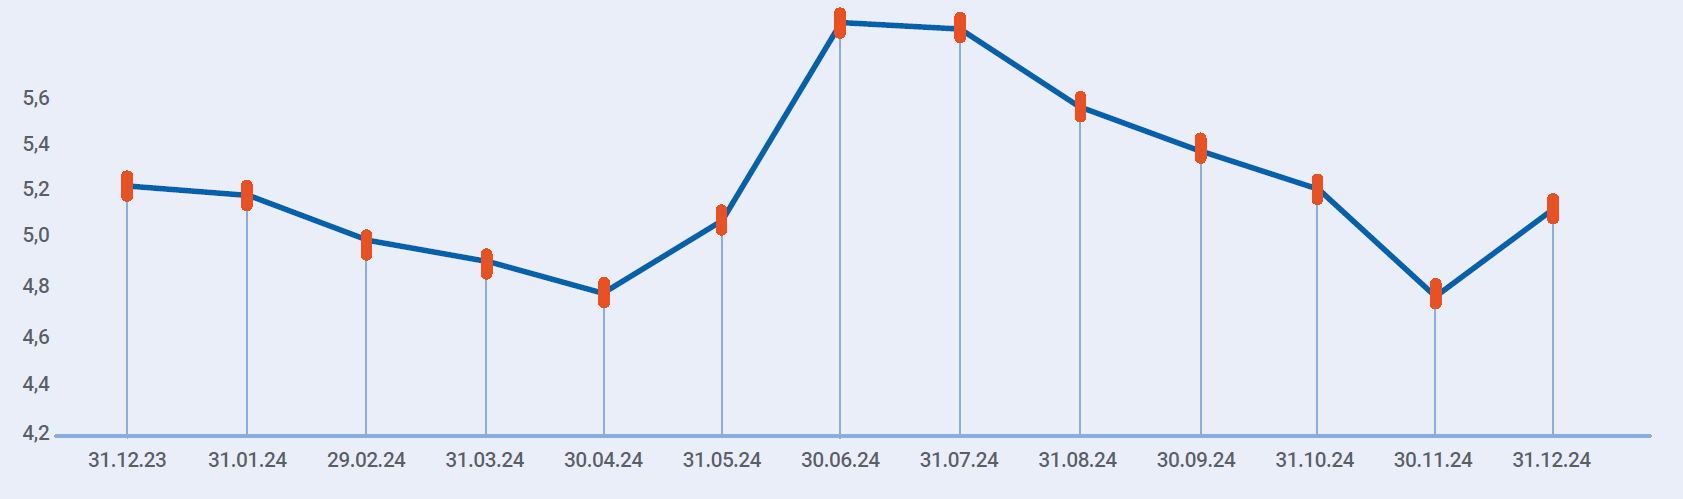
Exchange rate dynamics
| 31.12.2023 | 31.12.2024 | % | |
|---|---|---|---|
| KZT/USD | 454.56 | 523.54 | 115% |
| KZT/EUR | 502.24 | 546.47 | 109% |
| KZT/RUB | 5.06 | 4.99 | 99% |
KZT/USD
KZT/EUR
KZT/RUB
Financial and economic indicators
Key financial and economic indicators, KZT million25
| Indicator | 2022 fact | 2023 fact | 2024 fact | 2025 forecast |
|---|---|---|---|---|
| Income from sales of products and services | 381,465 | 444,96026 | 573,490 | 691,659 |
| Cost of sales and services rendered | 288,929 | 329,67626 | 371,645 | 479,409 |
| Gross profit | 92,536 | 115,284 | 201,845 | 212,250 |
| Operating profit | 64,574 | 92,828 | 172,987 | 176,610 |
| Profit before depreciation, interest, and CIT (EBITDA) | 141,382 | 159,484 | 226,241 | 266,714 |
| Profit (loss) before tax | 46,417 | 63,082 | 147,524 | 147,352 |
| Corporate income tax expenses | 16,111 | 19,352 | 34,555 | 34,009 |
| Total income (loss) before minority interest | 30,306 | 43,730 | 112,969 | 113,342 |
| Minority interest | 175 | 649 | 461 | 712 |
| Total income attributable to the Group's Shareholders | 30,132 | 43,080 | 112,508 | 112,631 |
25 The breakdown of revenues and cost of sales is shown by type of activity (not by segment) and is stated without elimination.
26 The financial indicators for 2023 are presented without restatement to reflect the acquisition of entities under common control – AES Shulbinsk HPP LLP and AES Ust Kamenogorsk HPP LLP.
Revenue from Sales of Products and Services
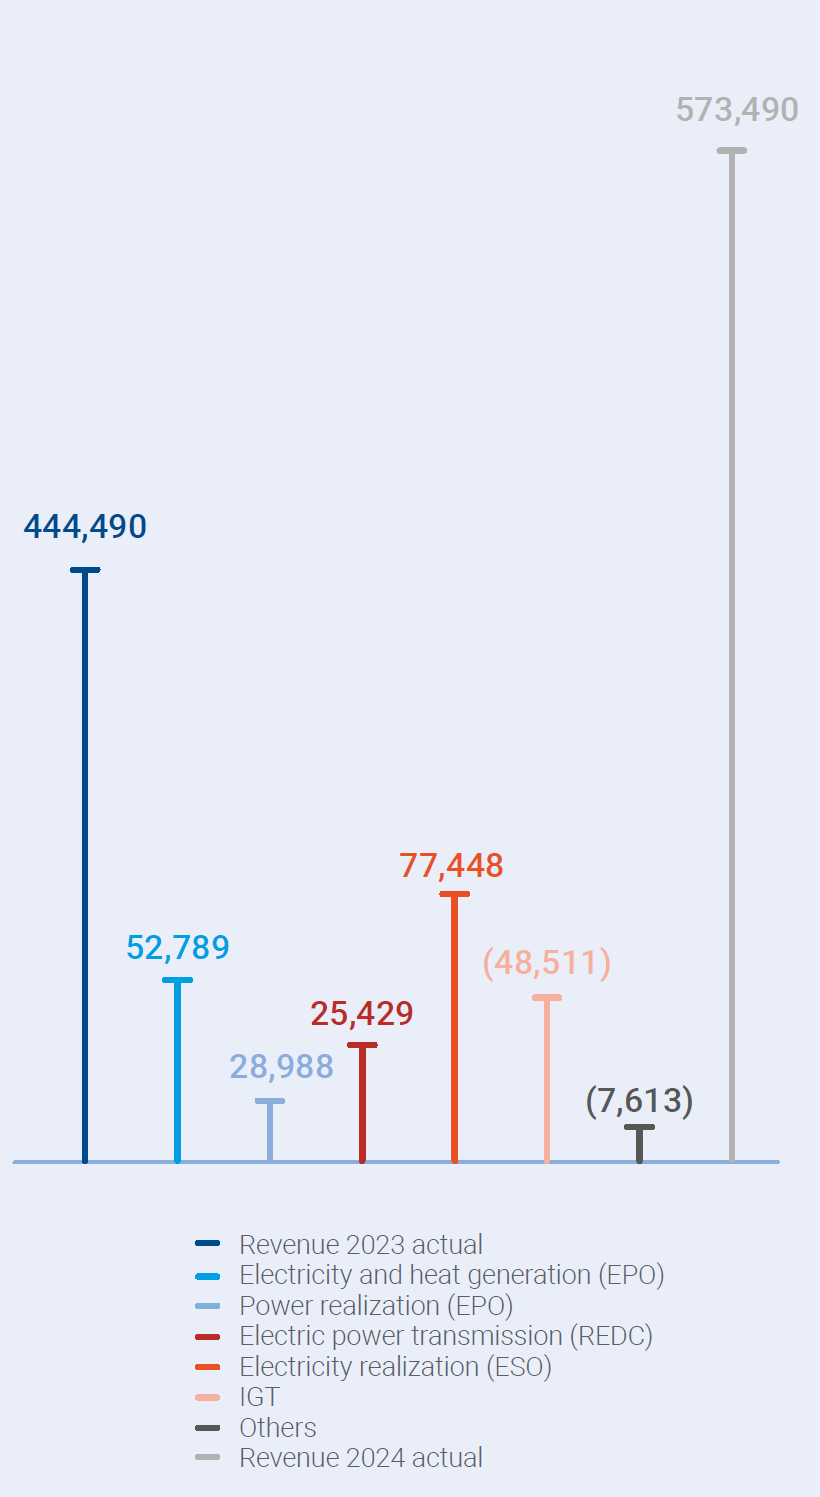
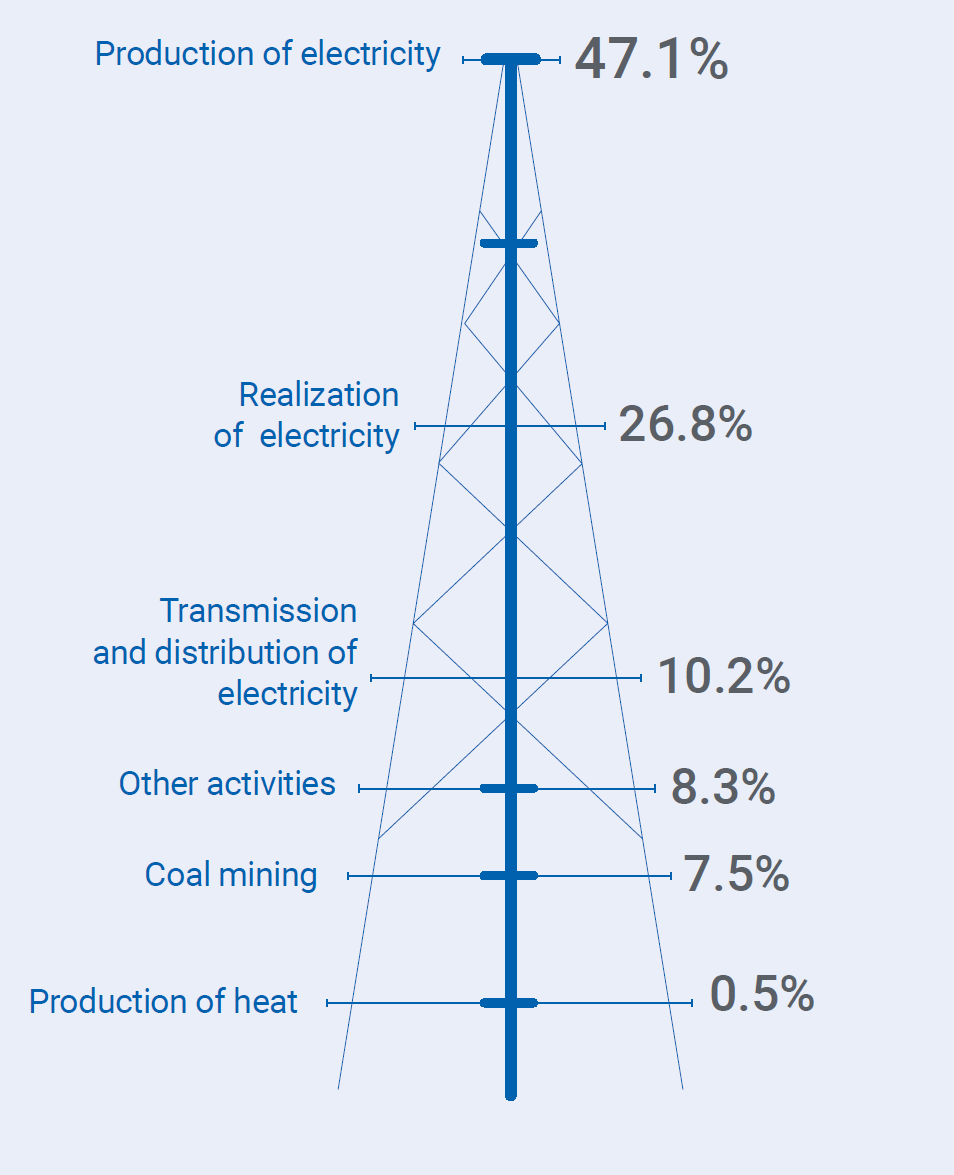
The increase in consolidated revenue occurred mainly in the sales segment; the growth in revenue is associated with an increase in electricity sales volumes by 1,651 million kWh (23%) and the electricity sales tariff of the Branch of Alatau Zharyk Company JSC – Energysales from 23.64 KZT/kWh to 28.03 KZT/kWh. The increase in revenue from electricity transmission is due to the growth in electricity transmission volumes by 572 million kWh (7%) and the electricity transmission tariff of Alatau Zharyk Company JSC from 7.68 KZT/kWh to 9.95 KZT/kWh.
In the power generation segment, revenue growth was due to the inclusion of AES Ust Kamenogorsk HPP LLP and AES Shulbinsk HPP LLP into the consolidation perimeter, growth in sales volumes of hydroelectric power plants due to higher inflow, increase in marginal tariffs of EPO from 1 January 2024, as well as due to the increase in the volume of capacity sales based on the results of the conducted tenders for 2024 and inclusion of capacity volumes of AES Ust Kamenogorsk HPP LLP and AES Shulbinsk HPP LLP into the consolidation perimeter.
Additionally, an increase is observed in the heat energy production segment due to the growth in sales volume of Almaty Electric Stations JSC and the inclusion of volumes of Energy Solutions Center LLP (Ekibastuz CHPP) in the consolidation perimeter. Furthermore, the tariff of Almaty Electric Stations JSC for thermal energy increased from 4,215 KZT/Gcal to 5,195 KZT/Gcal.
Revenue structure for 2024 by main types of activity
Forecast for the future period
In the forecast for 2025, revenue from sales is planned at KZT 691,659 million which is KZT 118,169 million or 21% higher than the actual for 2024. The increase is due to the growth of tariffs for electricity generation and sales, volumes and tariff for capacity (from KZT 1,065 k/MWh*month to KZT 1,169 k/MWh*month), as well as the commissioning of Block No.1 of LLP “Ekibastuz GRES-1”.
Income from sales of products and services by producers, KZT million
| Indicator | 2022 fact | 2023 fact | 2024 fact | 2025 forecast |
|---|---|---|---|---|
| Income from sales of products and services | 381,465 | 444,960 | 573,490 | 691,659 |
| Ekibastuz GRES-1 LLP | 189,266 | 186,939 | 198,847 | 257,776 |
| Branch of Alatau Zharyk Company JSC – Energy Sales | 137,578 | 168,309 | 247,127 | 304,146 |
| Almaty Electric Stations JSC | 86,220 | 96,660 | 125,605 | 133,983 |
| Alatau Zharyk Company JSC | 53,842 | 67,712 | 94,009 | 110,428 |
| Moynak HPP JSC | 22,804 | 21,720 | 25,768 | 21,761 |
| Shardara HPP JSC | 8,680 | 8,991 | 8,602 | 7,729 |
| AES Ust Kamenogorsk HPP LLP | - | - | 10,915 | 11,190 |
| AES Shulbinsk HPP LLP | - | - | 16,603 | 16,371 |
| First Wind Power Plant LLP | 4,987 | 6,170 | 6,641 | 7,918 |
| Bukhtarma HPP JSC | 4,181 | 21,837 | 16,520 | 24,135 |
| Energy Solution Center LLP (ETEC) | - | - | 4,233 | 10,594 |
| Branch of Energy Solution Center LLP – SSC | 1,515 | 1,595 | 1,945 | 3,209 |
| Samruk-Green Energy LLP | 409 | 500 | 659 | 755 |
| Intragroup turnovers (elimination) | -128,016 | -135,475 | -183,986 | -218,337 |
The major share in the Company's operating income is held by Ekibastuz GRES-1 LLP, Almaty Electric Stations JSC, Alatau Zharyk Company JSC, Branch of Alatau Zharyk Company JSC – Energоsbyt. At the same time, when consolidating revenues, intragroup turnovers are excluded from the total amount mainly for energy producing and distribution companies.
Cost of sales
Cost of products and services, KZT million
| Indicator | 2022 fact | 2023 fact | 2024 fact | 2025 forecast |
|---|---|---|---|---|
| Fuel | 68,247 | 91,379 | 105,269 | 138,644 |
| Labour remuneration and related costs | 45,643 | 53,766 | 69,099 | 85,019 |
| Cost of purchased electricity | 50,991 | 56,404 | 46,366 | 63,763 |
| Electric capacity availability maintenance services | 8,819 | 8,848 | 15,644 | 20,714 |
| Depreciation of property, plant and equipment and amortisation of NMA | 59,764 | 62,556 | 58,020 | 76,220 |
| Repairs and maintenance | 9,950 | 11,377 | 12,979 | 16,757 |
| Electricity transmission services | 16,847 | 16,922 | 20,307 | 20,752 |
| Materials | 2,181 | 2,777 | 4,335 | 5,425 |
| Water supply | 7,106 | 7,582 | 10,464 | 12,092 |
| Network losses | 2 | 2 | 0 | 0 |
| Taxes, except income tax | 4,642 | 4,633 | 5,042 | 7,127 |
| Environmental emission charges | 7,664 | 4,435 | 5,337 | 9,223 |
| Third-party services | 3,385 | 3,350 | 11,719 | 14,507 |
| Others | 3,688 | 5,643 | 7,064 | 9,166 |
| Total | 288,929 | 329,676 | 371,645 | 479,409 |
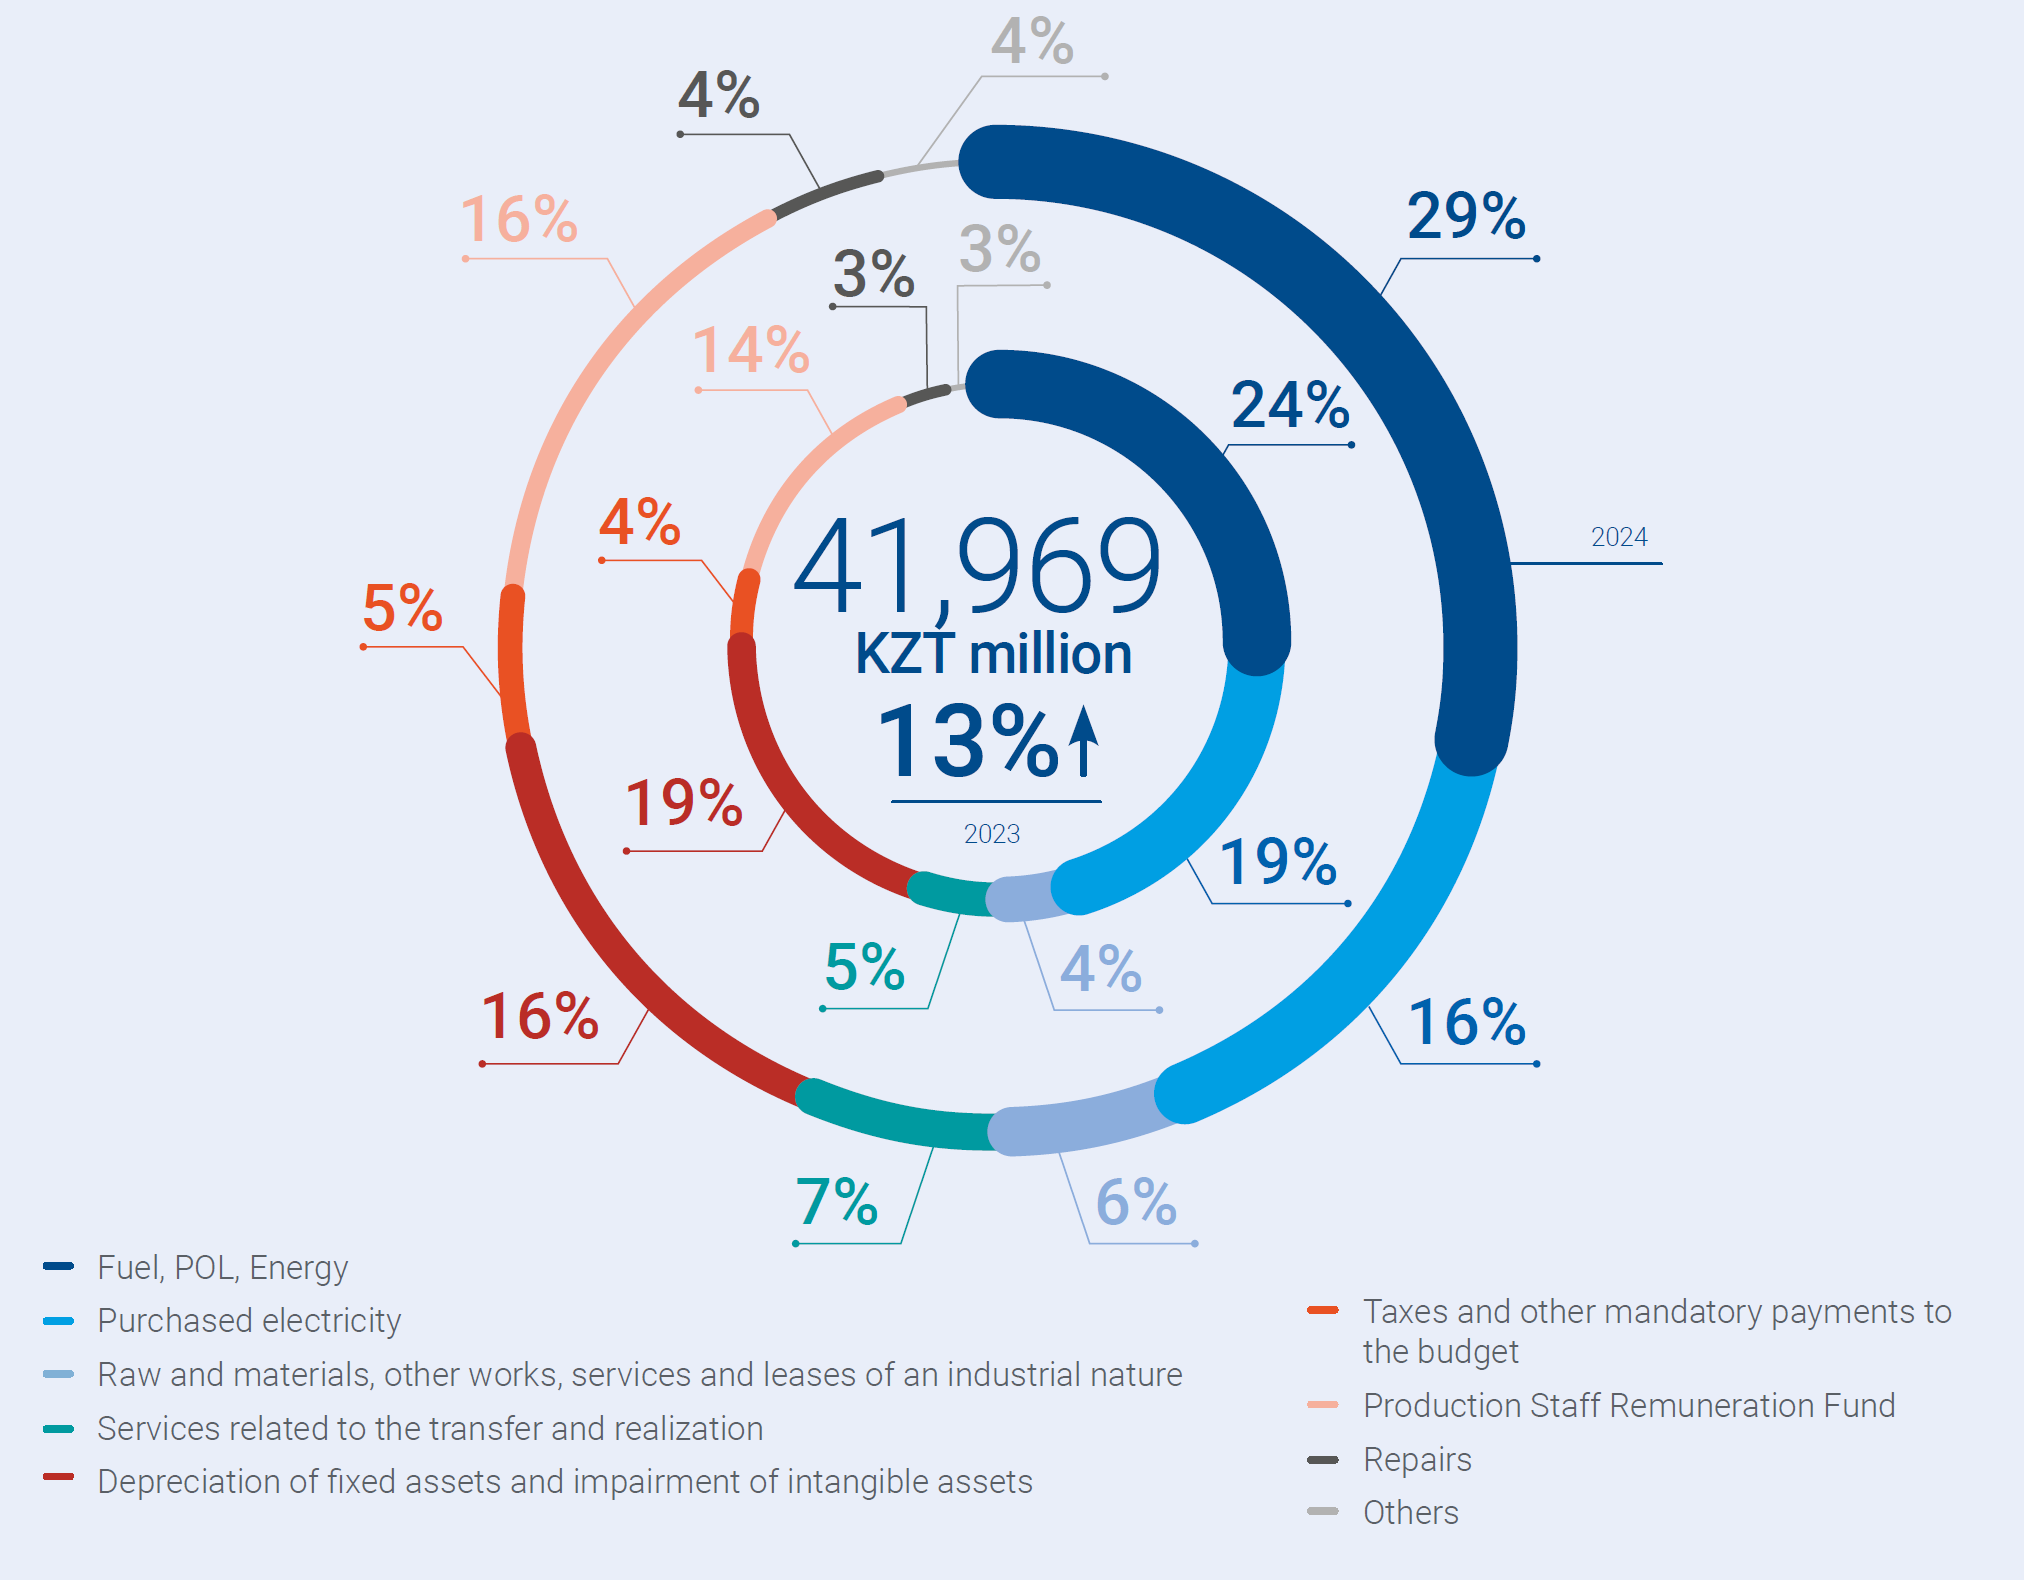
Cost of sales for 2024 totalled KZT 371,645 million, which is 13% higher than in 2023. The increase in costs is due to an increase in variable production costs (coal, gas, services of KEGOC JSC, etc.) in connection with the growth of prices for goods and services, costs on the balancing electricity market (hereinafter – BEM), labour costs of production personnel as part of social support to employees of subsidiaries and affiliates, taxes and other mandatory payments to the budget, indexation of prices for raw materials and production materials.
Depreciation for 2024 was KZT 58,020 million, a decrease of KZT 4,536 million or 8% compared to the same period last year. The main decrease for Ekibastuz GRES-1 LLP is due to revision of service life of fixed assets.
Cost structure by main types of activity
Forecast for the future period
In the forecast for 2025, the cost of production increases due to higher prices for goods and services, the cost of purchasing balancing electricity at the BRE, an increase in labour costs for production personnel, as well as an increase in production volumes.
Profit and selling expenses
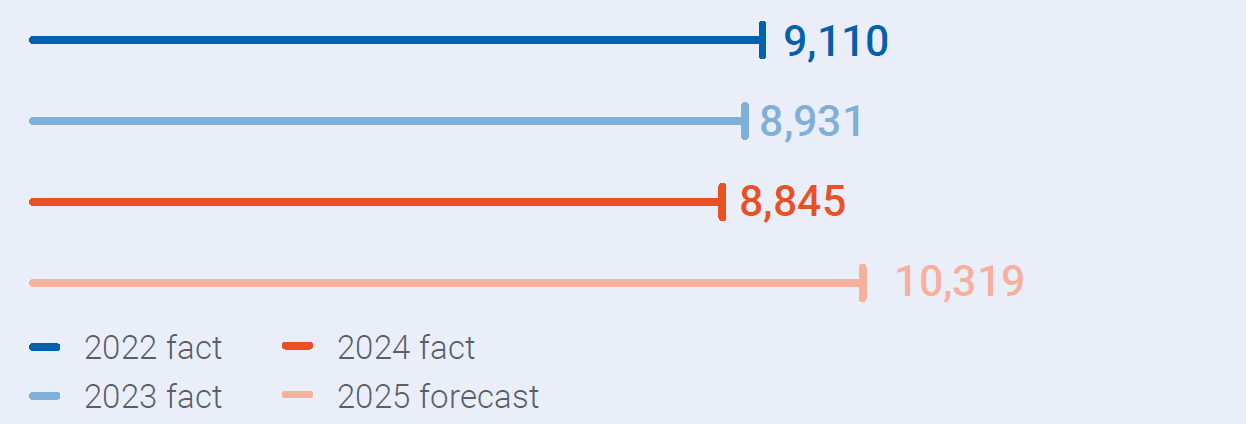
Sales expenses for 2024 decreased by KZT (86) million (by 1%) compared to 2023 and totalled KZT 8,845 million. This deviation is caused by a decrease in costs for KEGOC JSC services in organising the balancing of electricity production-consumption due to the tariff reduction.
Distribution costs, KZT million
Forecast for the future period
In the forecast for 2025, distribution costs are planned at KZT 10,319 million, which is KZT 1,474 million or 17% higher than in 2024. The increase in distribution costs is due to an increase in the volume of electricity output from the tyres of Ekibastuz GRES-1 LLP (commissioning of Block No.1), as well as an increase in the prices for the services of KEGOC JSC.
Administrative expenses
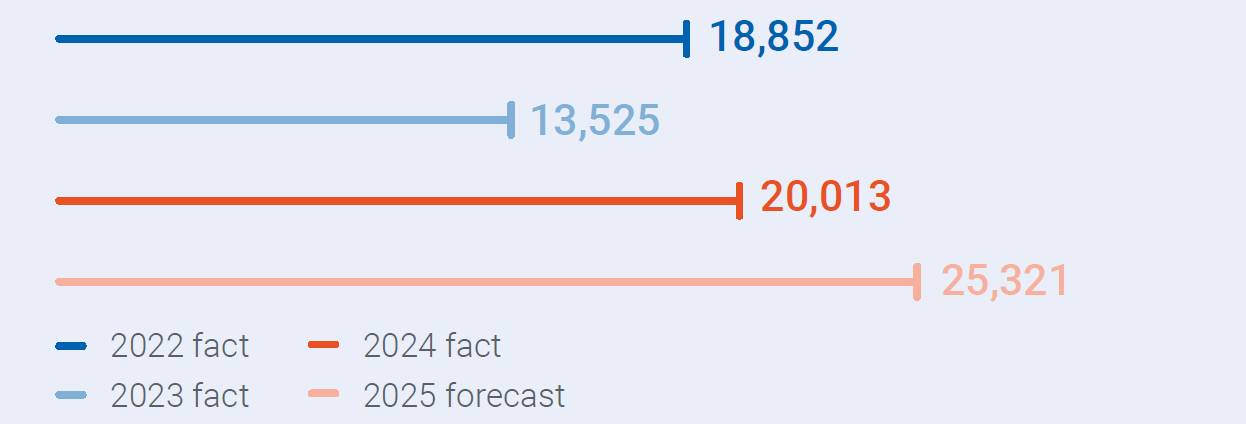
At year-end 2024, administrative expenses totalled KZT 20,013 million, up KZT 6,488 million or 48% on the same period in 2023, mainly due to the inclusion of AES Ust Kamenogorsk HPP LLP, AES Shulbinsk HPP LLP and Energy Solutions Centre LLP (Ekibastuz CHPP) within the consolidation perimeter.
Administrative expenses, KZT million
Forecast for the future period
In the forecast for 2025, administrative expenses are higher than the 2024 level by KZT 5,308 million. The increase is mainly due to the indexation of wages as part of social support for employees of subsidiaries. Also, the increase is due to the inclusion in the consolidation perimeter of the Company of OAR Energy Solutions Center LLP (Ekibastuz CHPP) (in the actual for 2024, these expenses were consolidated for 5 months).
Finance costs
Finance costs for 2024 amounted to KZT 31,322 million, which is KZT 6,078 million higher than the actual value for 2023. The increase is due to the recognition of expenses on loans of Ekibastuz GRES-1 LLP (Block No.1) in current expenses.
Financial costs, KZT million
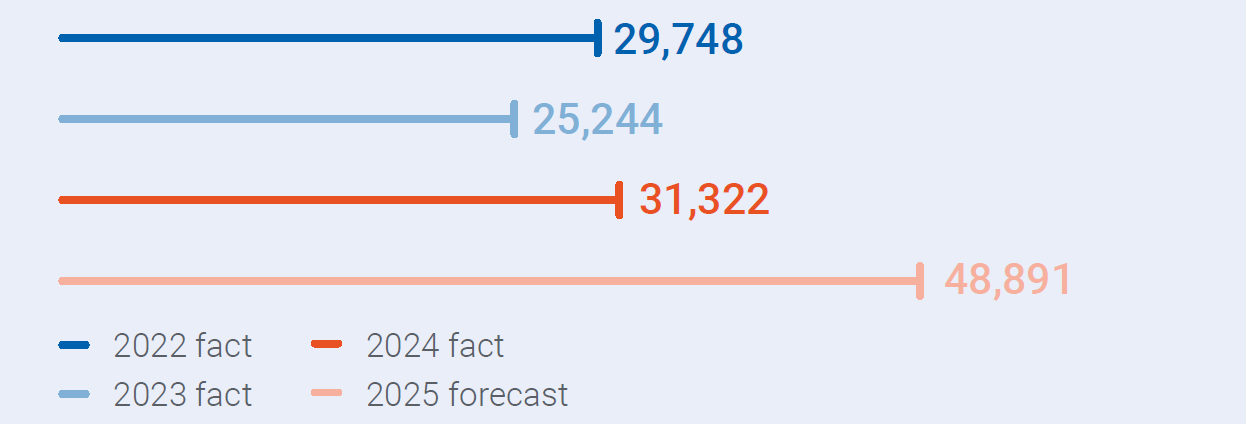
Forecast for the future period
In the forecast for 2025, finance costs amount to KZT 48,891 million. The increase is mainly due to the recognition of expenses on loans of Ekibastuz GRES‑1 LLP (reconstruction and modernisation of fuel supply) and Almaty Electric Stations JSC (gasification of the Almaty energy complex) in current expenses.
Share of profit of joint ventures and associates
| Indicator, KZT million | 2022 fact | 2023 fact | 2024 fact | 2025 forecast |
|---|---|---|---|---|
| Share of profit of joint ventures and associates | 16,103 | 3,121 | -5,856 | 12,499 |
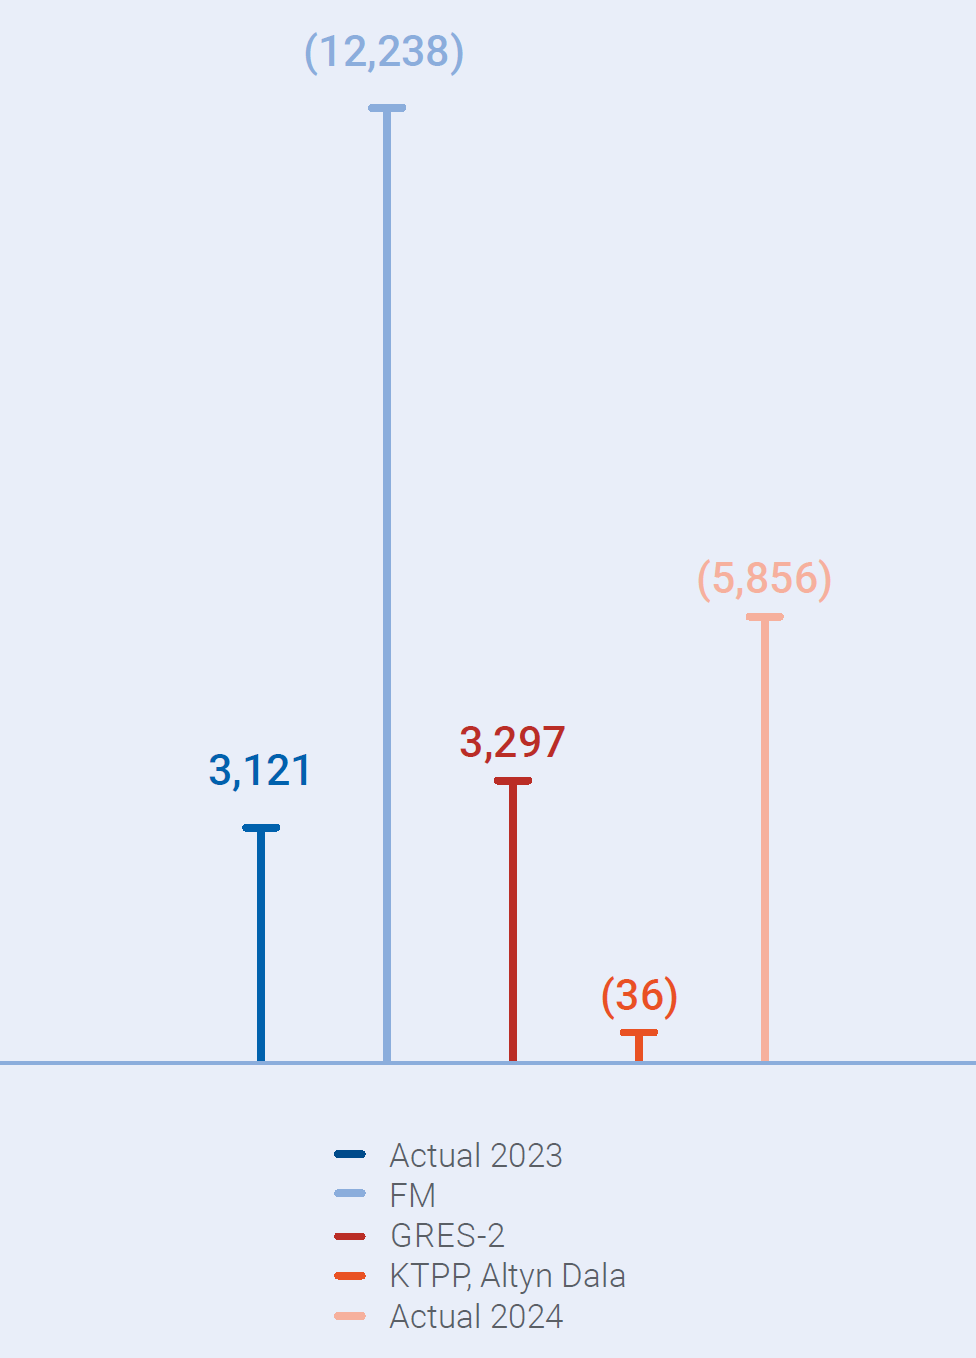
Loss from equity companies for 2024 totalled KZT 5,856 million, a decrease of KZT 8,977 million compared to the same period, mainly due to a decrease in operating profit as a result of lower operating income (lower export volumes) and higher operating costs, as well as higher financing costs (exchange rate difference) and other expenses from non-core activities (including impairment loss on other assets).
Liquidity and financial stability indicators
Samruk-Energy JSC has achieved the target indicators for financial stability ratios set by the shareholder.
Fulfilment of covenants from external creditors
| Covenant | Normative | 2021 fact | 2022 fact | 2023 fact | 2024 fact | Note |
|---|---|---|---|---|---|---|
| Debt/EBITDA (EBRD, ADB) | no more than 3.5 | 2.70 | 2.14 | 1.74 | 1.62 | Observed |
| EBITDA/Interest (EBRD, ADB) | at least 2.2 | 5.00 | 5.92 | 10.8 | 12.23 | Observed |
| Debt/Equity (BDC) | no more than 2.0 | 0.59 | 0.50 | 0.43 | 0.49 | Observed |
| Name | 2019 fact | 2020 fact | 2021 fact | 2022 fact | 2023 fact | 2024 fact |
|---|---|---|---|---|---|---|
| Debt/EBITDA | 3.31 | 2.96 | 2.41 | 1.90 | 1.71 | 1.66 |
| Debt/Equity | 0.56 | 0.54 | 0.59 | 0.50 | 0.43 | 0.49 |
| Current liquidity | 0.70 | 0.75 | 0.53 | 0.57 | 1.04 | 1 |
Based on the results of 2024, Samruk-Energy JSC complied with financial and non-financial covenants of creditors, which are fixed on a semi-annual basis.
Debt burden
According to the results of 2024, the consolidated nominal debt of the Company totalled KZT 403.3 billion, the increase in nominal debt for the reporting period compared to the results of 2023 (KZT 310.3 billion) amounted to KZT 93 billion.
The increase in nominal debt in 2024 is due to borrowings for the investment projects of Almaty Electric Stations JSC for the CHPP-2 project and projects of Ekibastuz GRES‑1 LLP.
In order to mitigate interest rate risk, in September 2024 the partial early repayment of the KZT 34.7 billion loan from Halyk Bank of Kazakhstan JSC was carried out with a reduction in the rate from 16.5%–18.75% to 16.25% at Ekibastuz GRES-1 LLP.
Credit rating (Fitch Ratings)
On October 14, 2024, the international rating agency Fitch Ratings affirmed the long-term credit ratings of Samruk- Energy JSC in foreign and national currency at BB+, outlook “Stable”.

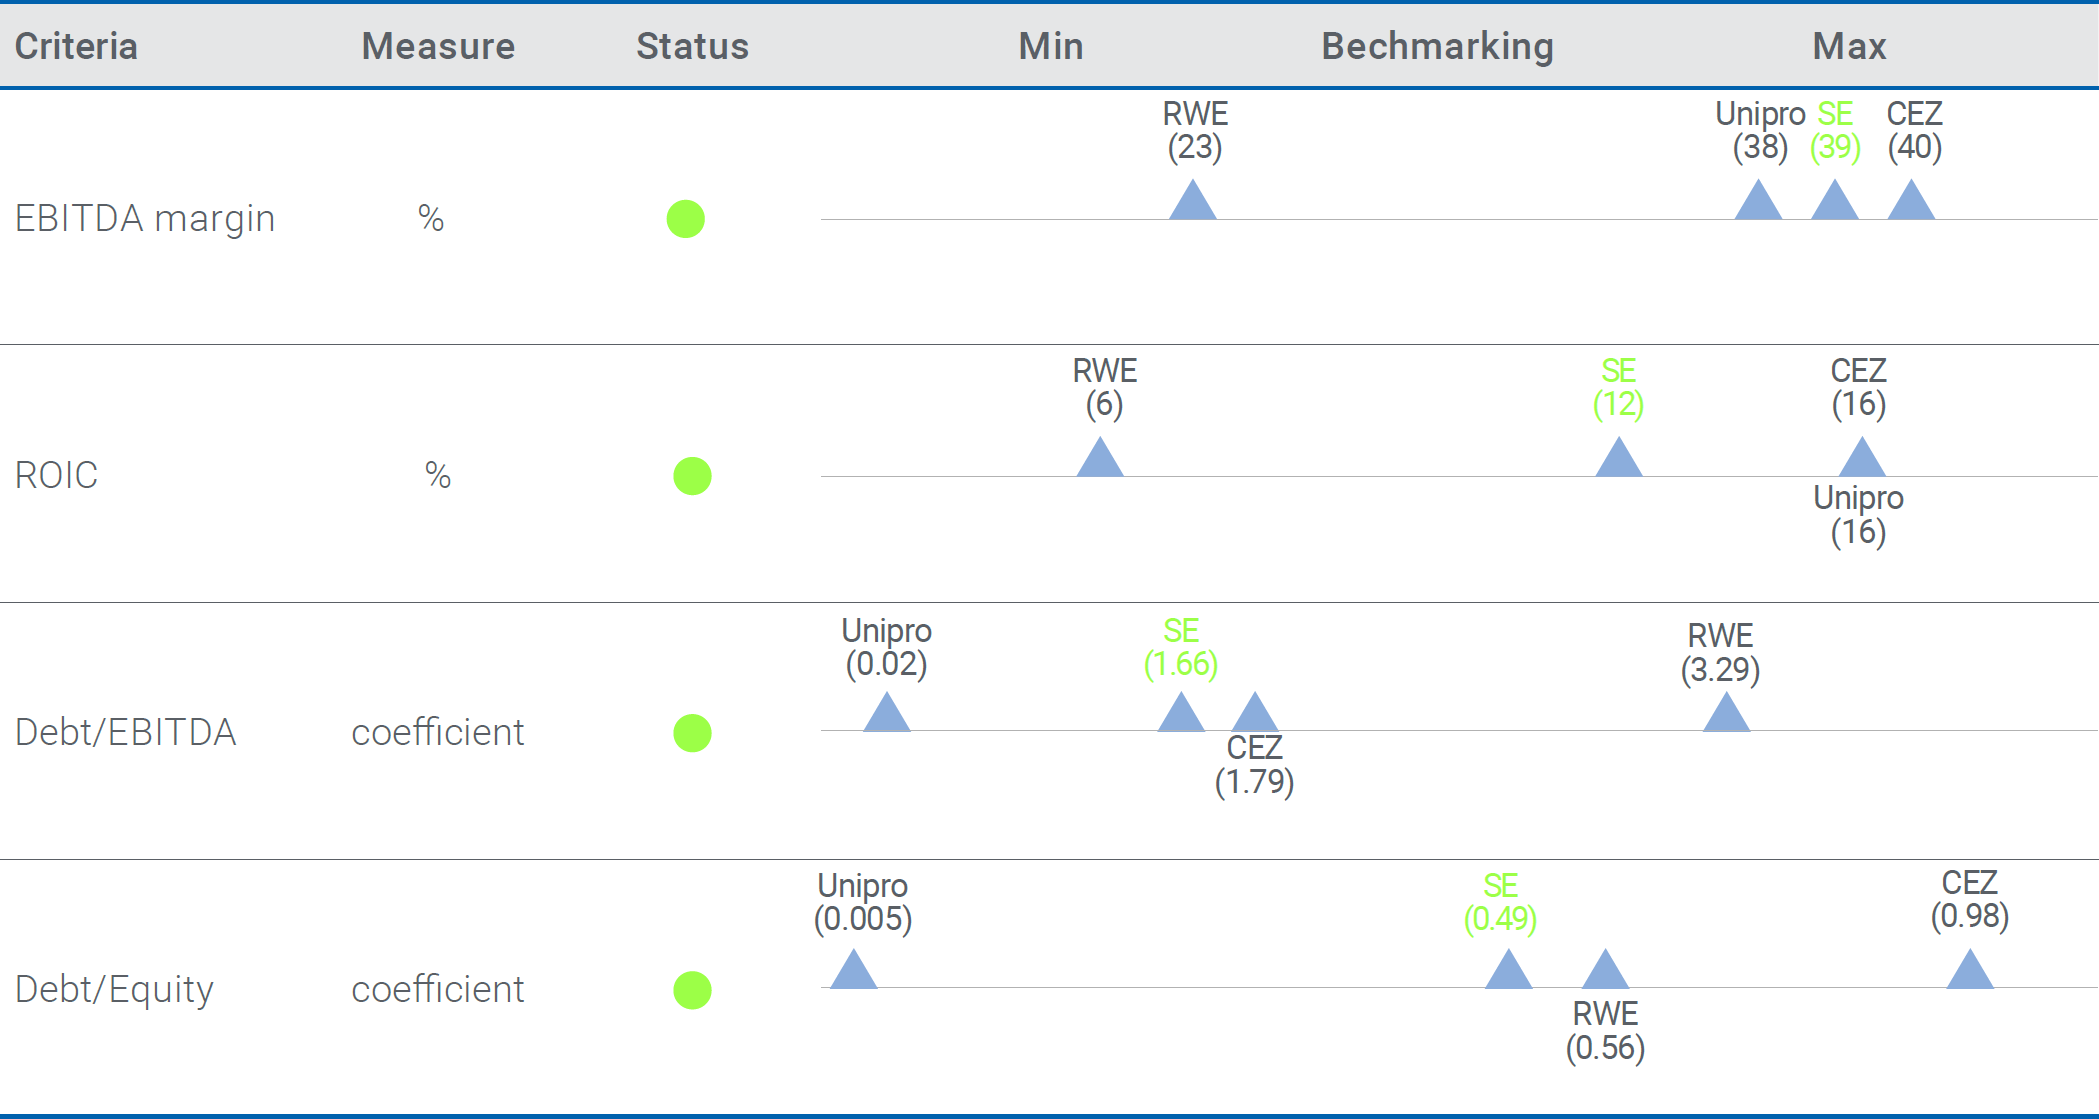
Comparative analysis (benchmarking)
Benchmarking is one of the important elements of the Company's management. The purpose of benchmarking is to compare operational and financial indicators with foreign analogue companies in order to determine the Company's weaknesses and strengths. The following indicators were used for benchmarking:
- EBITDA margin (EBITDA margin);
- Debt/EBITDA;
- Debt-to-equity ratio (Debt/Equity);
- Return on Invested Capital (ROIC).
Data from the following peer companies were used for benchmarking:
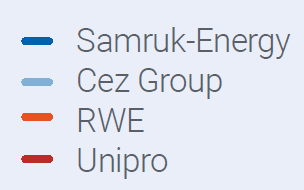
- PJSC “Unipro” (Russia);
- CEZ Group (Czech Republic);
- RWE (Germany).
Benchmarking results
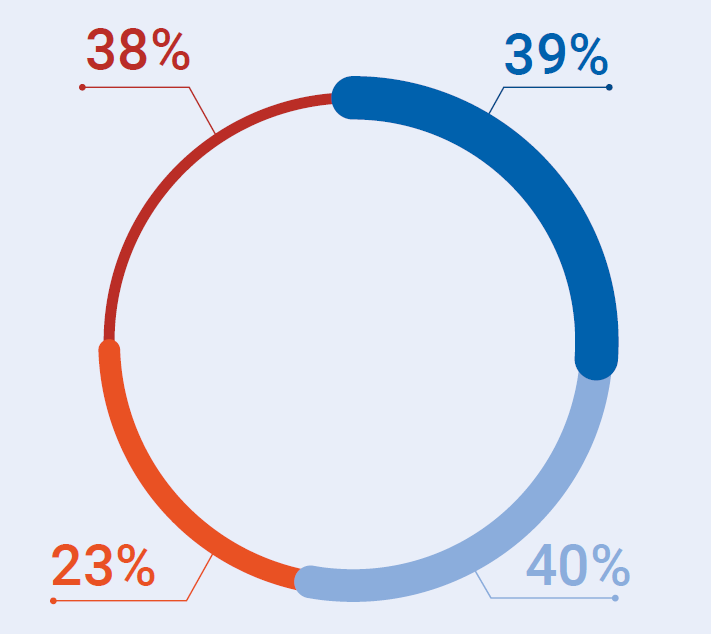
EBITDA margin for 2024
Return on Invested capital (ROIC) for 2024

Currently, compared to foreign peer companies, the Company lags behind in some indicators.
The EBITDA margin is a key indicator of the Сompany’s operational efficiency, reflecting its ability to generate profit before interest, taxes, depreciation, and amortization. Compared to other companies such as Unipro, RWE, Samruk-Energy JSC demonstrates a high level of operational efficiency with an EBITDA margin of 39%, but is slightly behind CEZ Group.
In terms of Debt/EBITDA and Debt/Equity, Samruk- Energy JSC is at an average level compared to CEZ Group and RWE, but significantly lags behind Unipro in terms of financial stability.
In terms of ROIC (return on invested capital), Samruk‑Energy JSC is below CEZ Group and Unipro, but 6% higher than RWE.
It should be noted that, unlike public peer companies, Samruk-Energy JSC is owned by the Government of the Republic of Kazakhstan, and therefore, the Company acts as a conduit for state policy in the electric power sector. In this regard, and also due to the high degree of wear and tear in the energy sector, since 2009, socially significant investment projects have been implemented (aimed at the reliability and uninterrupted operation of the energy system of the Republic of Kazakhstan), which has led to a significant increase in invested capital and, accordingly, reduced the return‑on-investment indicator.
An additional factor affecting the return-on-investment indicators is the low level of electricity tariffs in the Republic of Kazakhstan compared to the countries of peer companies.
Average tariff for electricity 2024, tenge/kWh
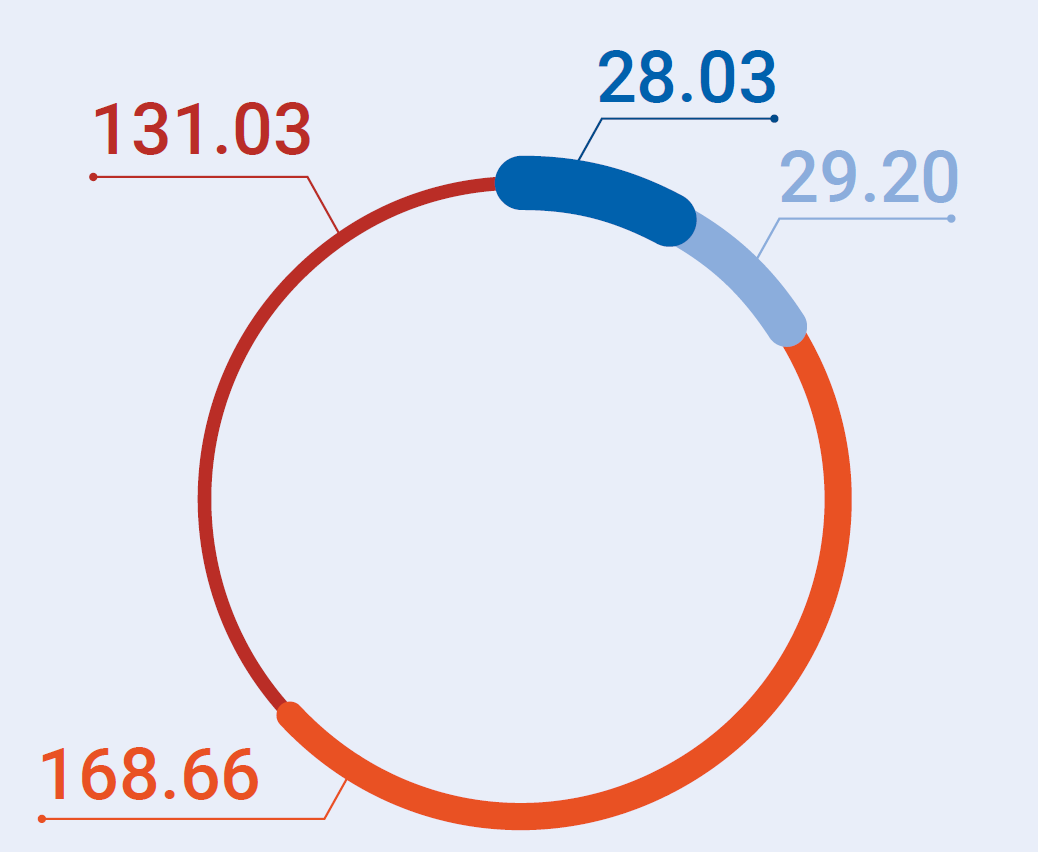
Difference in electricity tariffs in the countries of peer companies27
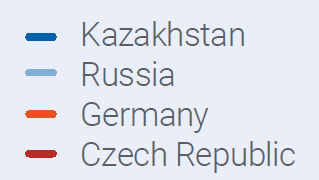
| Country | Medium tariff per kWh28 | In KZT/kWh | Medium rate for 202429 |
|---|---|---|---|
| Kazakhstan | KZT 28.03 | 28.03 KZT/kWh | |
| Russia | RUB 5.75 | 29.20 KZT/kWh | 5.08 KZT/RUB |
| Germany | EUR 0.33 | 168.66 KZT/kWh | 507.86 KZT/EUR |
| Czech Republic | CZK 6.48 | 131.03 KZT/kWh | 20.22 KZT/CZK |
27 Source: Eurostat, Rosstat.
28 The average tariff for the end consumer for the Company's group, excluding VAT.
29 Average rate according to the data of the National Bank of Kazakhstan.