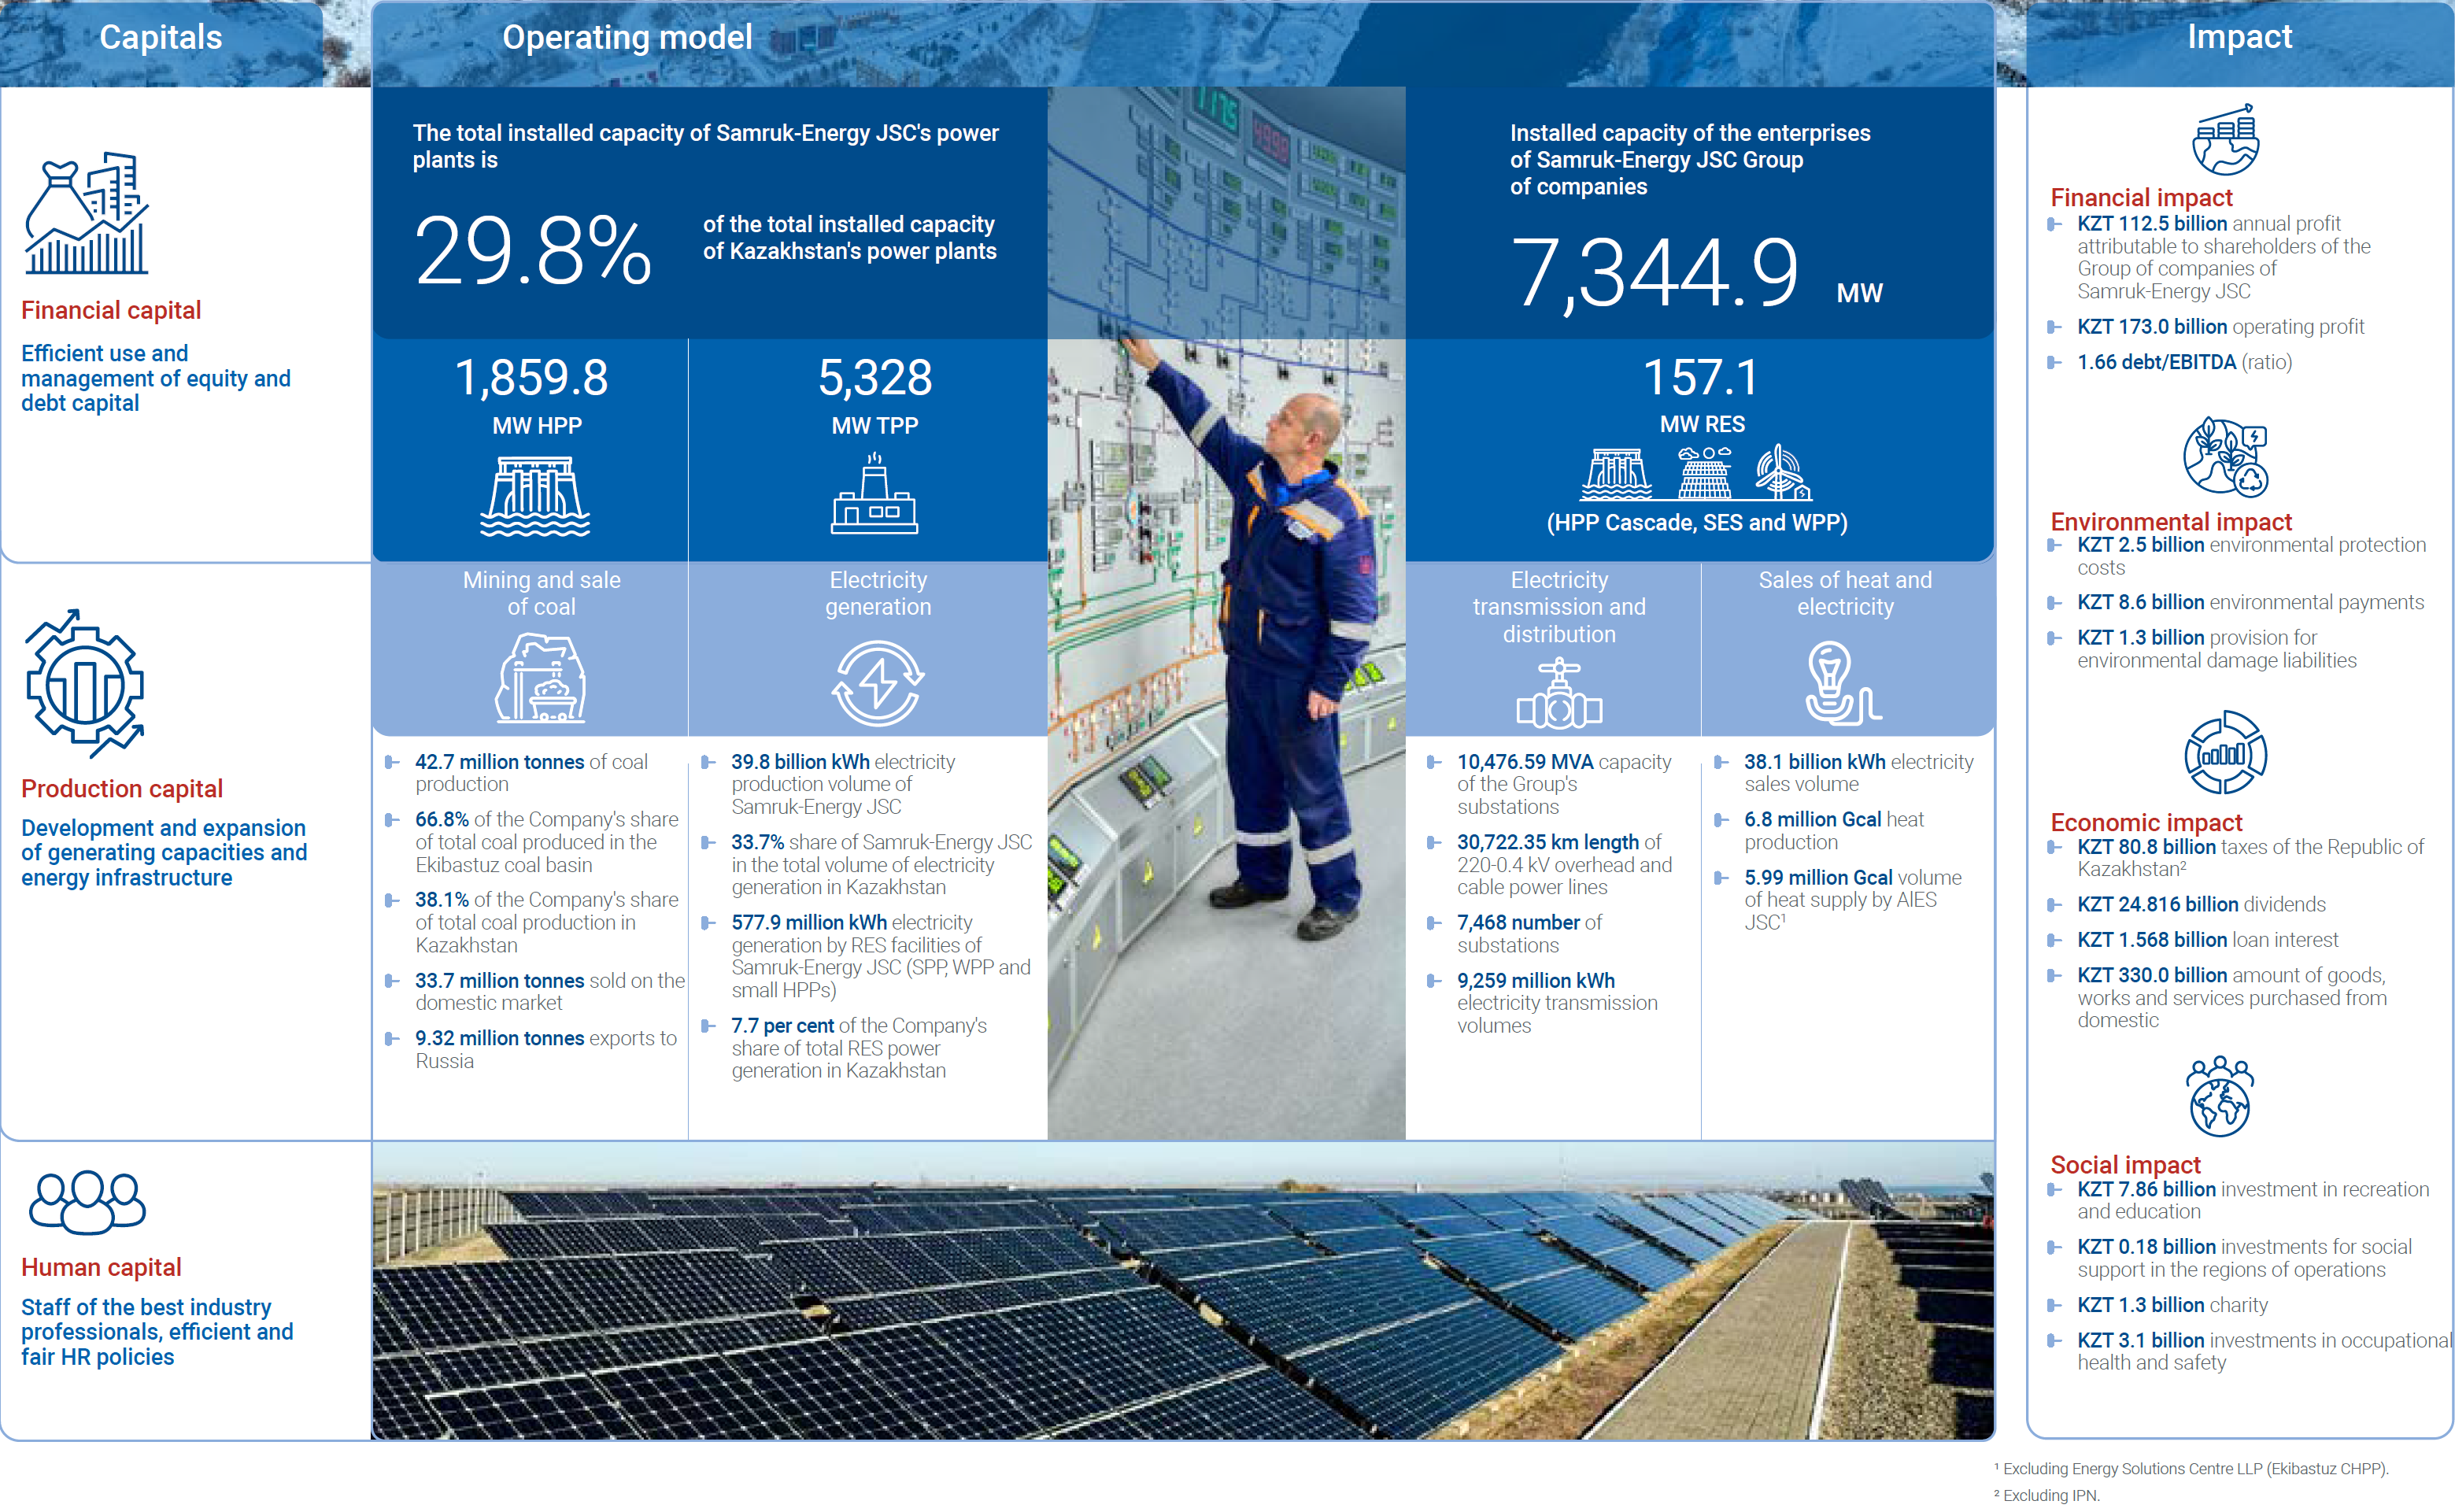
Business model
Key indicators of the Business Plan of Samruk-Energy JSC
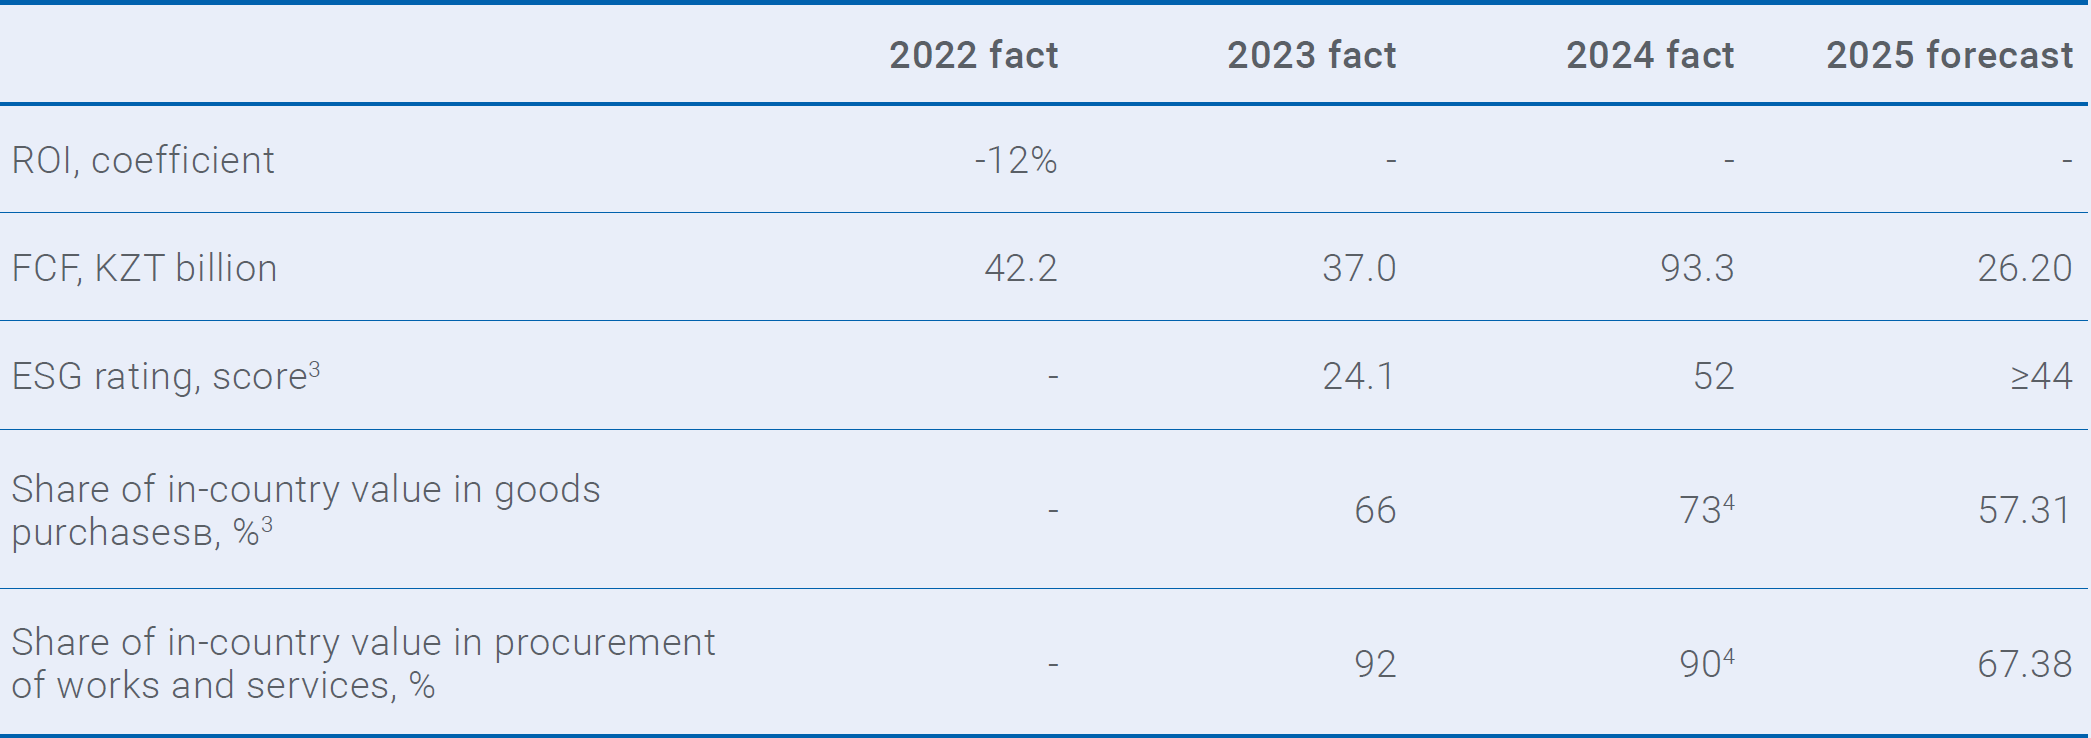
Tier 1 Strategic KPIs for PCs
Tier 1 Strategic and Analytical KPIs for PCs
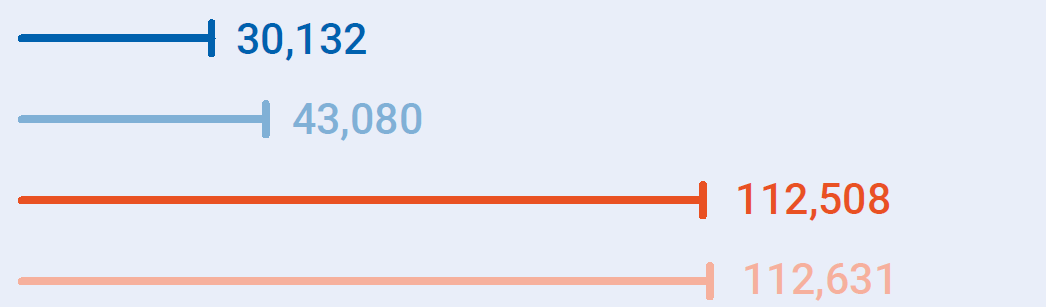
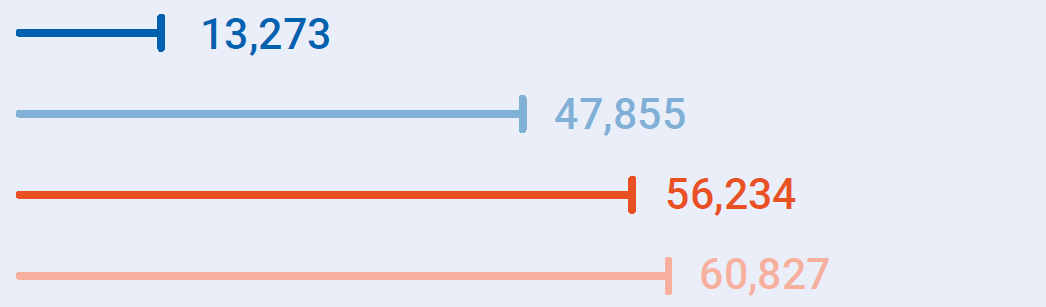
Net income, KZT million
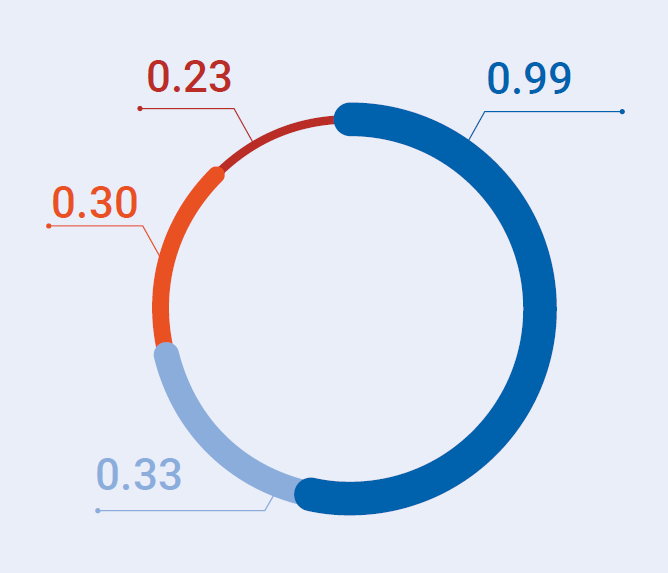
Debt/EBITDA (ratio)

ROACE, %

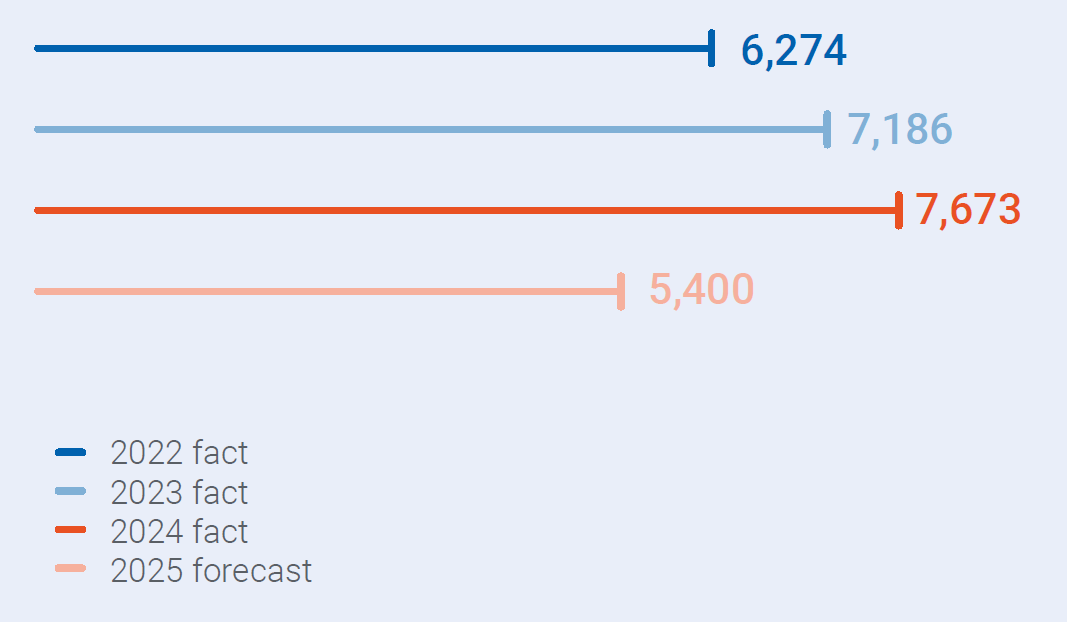
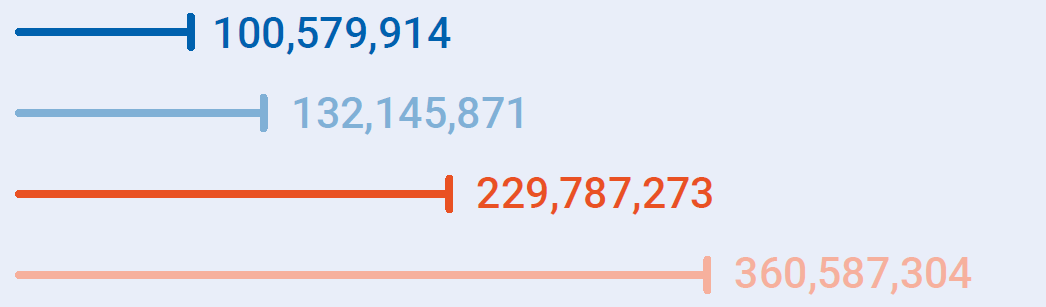
Net asset value (NAV), KZT million

Leadership Behavioural Safety Audit
3 These efficiencies are introduced from 2023 onwards.
4 Fact of 2024 for SAC taking into account newly entered subsidiaries and affiliates (AES Ust‑Kamenogorsk HPP LLP, AES Shulbinsk HPP LLP, ESC LLP (Ekibastuz CHPP), Kokshetau CHPP LLP).
4 Fact of 2024 for SAC taking into account newly entered subsidiaries and affiliates (AES Ust‑Kamenogorsk HPP LLP, AES Shulbinsk HPP LLP, ESC LLP (Ekibastuz CHPP), Kokshetau CHPP LLP).
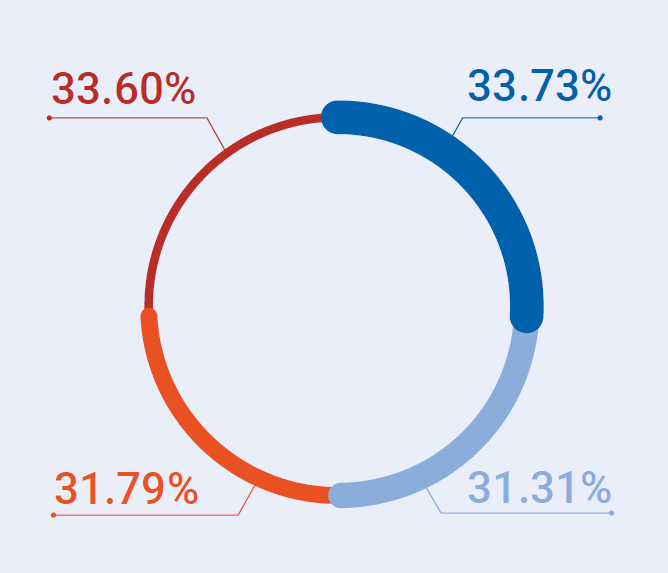
Industry KPIs
Electricity market share in RoK
LTIFR
Key national indicators
Labour productivity, thousand KZT/person
Investments in fixed assets, ‘000 KZT
Electricity generation from renewable energy sources, ‘000 kWh

Gross inflow of foreign direct investment,
USD billion